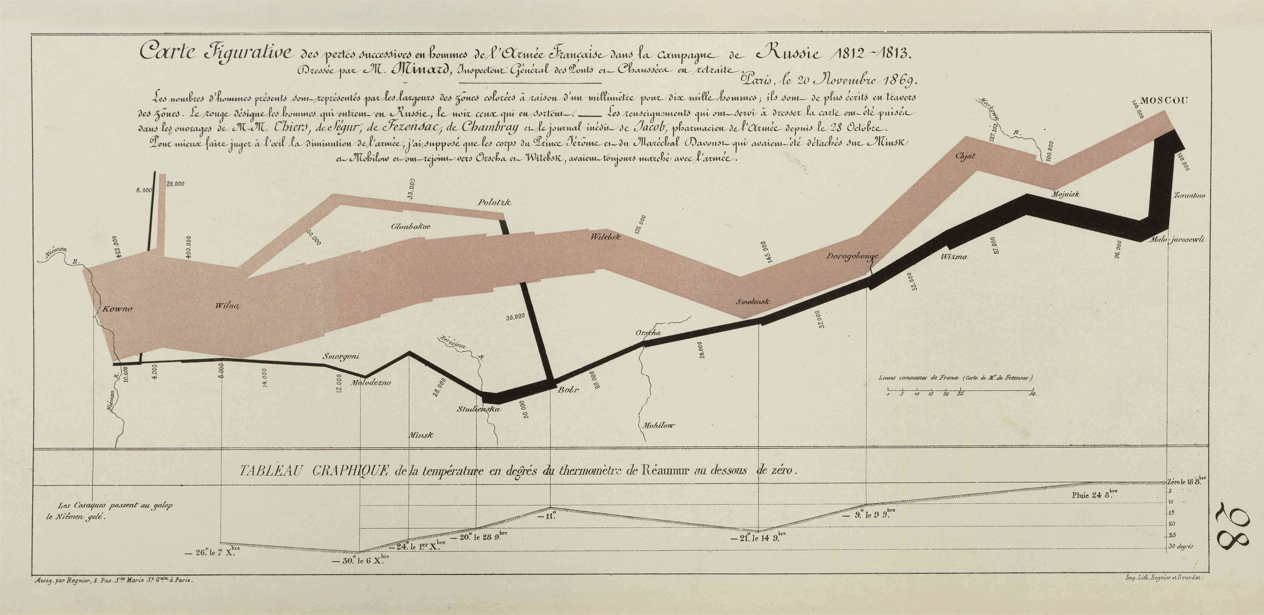
Charles Minard’s 1869 cartographic depiction of numerical data on Napoleon’s disastrous losses sufered during the Russian campaign of 1812 is a crucial piece in the development of information graphics, fow maps, and graphic design in general. The illustration depicts Napoleon’s army departing the Polish-Russian border, where a thick band refects the size of his army at specifc geographic points during their advance and retreat. It displays six types of data in two dimensions: the number of Napoleon’s troops, the distance travelled, temperature, latitude and longitude, the direction of travel, and the location relative to specifc dates without making mention of Napoleon.
Minard’s interest was to reveal the shocking magnitude of the losses incurred by French soldiers. This type of band chart visualisation became a crucial component in modern means of representing data. The depicted subject is a key moment in European history—an episode that would lay the groundwork for all the major European and colonial events that would take place over the next two centuries.
The presentation of this work is made possible through the support of Alliance Française and Institut Français.
Location Map

Designed & Developed by: Curves n' Colors | Visual identity by: Wkshps
